Good management reporting does more than present monthly financial results. It helps decision-makers understand business performance, identify what is driving results and determine what needs to happen next. Yet many organisations still rely on reports that summarise historical figures without providing the insight needed to make informed decisions.
If your accounting system is like most financial systems, your month-end reports may look familiar:
- Static, fixed-format financial statements
- Dense tables of numbers that are hard to interpret
- Limited flexibility to present data in the way you actually want to see it
- Little to no commentary to explain what’s driving results
- And a board that still asks, “So… what does this mean?”
The numbers are there. But the insight isn’t.
Data Isn’t the Problem. Context Is.
Finance leaders, CFOs, and business owners don’t struggle with a lack of data. What’s missing is the translation of the data into meaning.
When explanation is missing, decision-making slows down. When decision-making slows down, opportunities get missed.
Good reporting doesn’t just report history. It tells a story. It helps the business understand what changed, why it changed, and what should happen next.
The Good News
You probably don’t need to replace your accounting system. Replacing financial systems is expensive, disruptive, and often unnecessary. Your existing system is usually doing its job — recording transactions accurately.
What’s missing is a way to communicate the results. This is where Solver comes in.
Solver sits on top of your existing financial system and helps turn your data into meaningful, decision-ready information. It allows you to:
- Pull in actuals and budgets automatically.
- Connect financial and operational data from multiple business systems, bringing information together to provide a more complete picture of business performance.
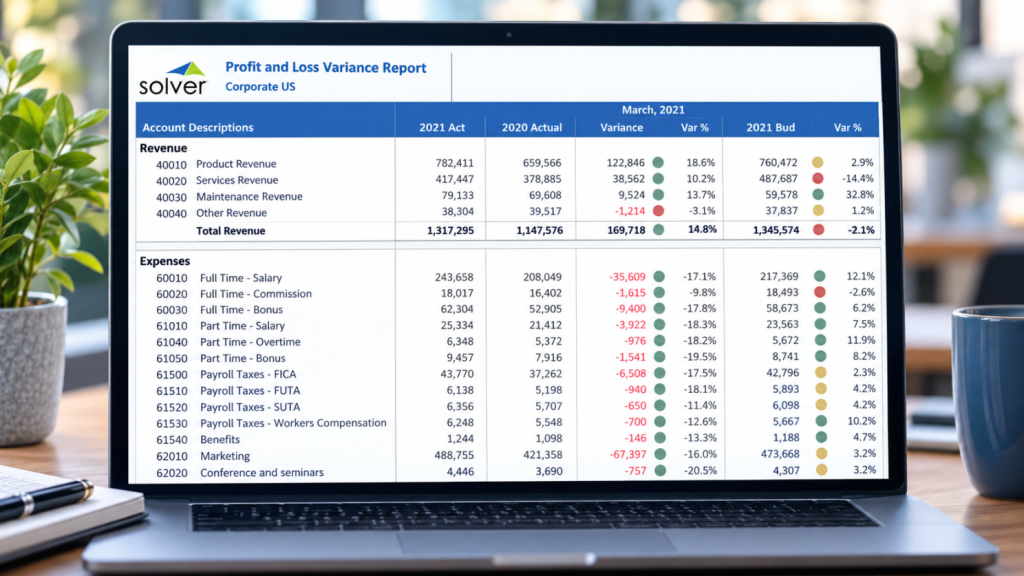
- Present financials in clear, decision-ready layouts and a variety of meaningful formats.
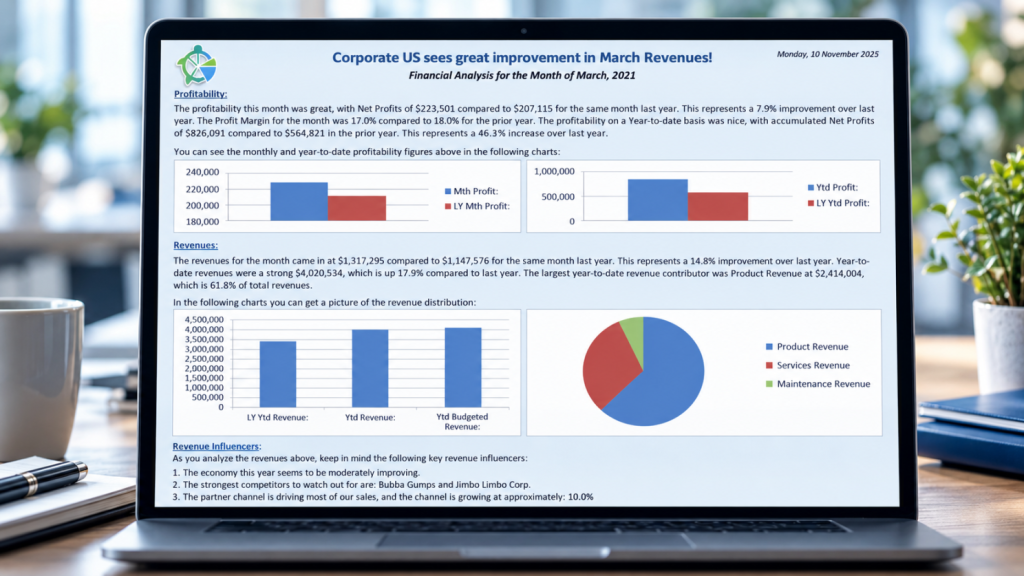
- Add narrative commentary directly within reports to explain what is driving results.
- Highlight key variances and performance drivers clearly and consistently.
Solver can connect with a range of financial and operational systems, helping businesses bring relevant information together for reporting, budgeting and forecasting. This means you can build on the systems you already use, rather than necessarily replacing them to gain better visibility across your business.
Instead of replacing the engine, you simply upgrade the dashboard